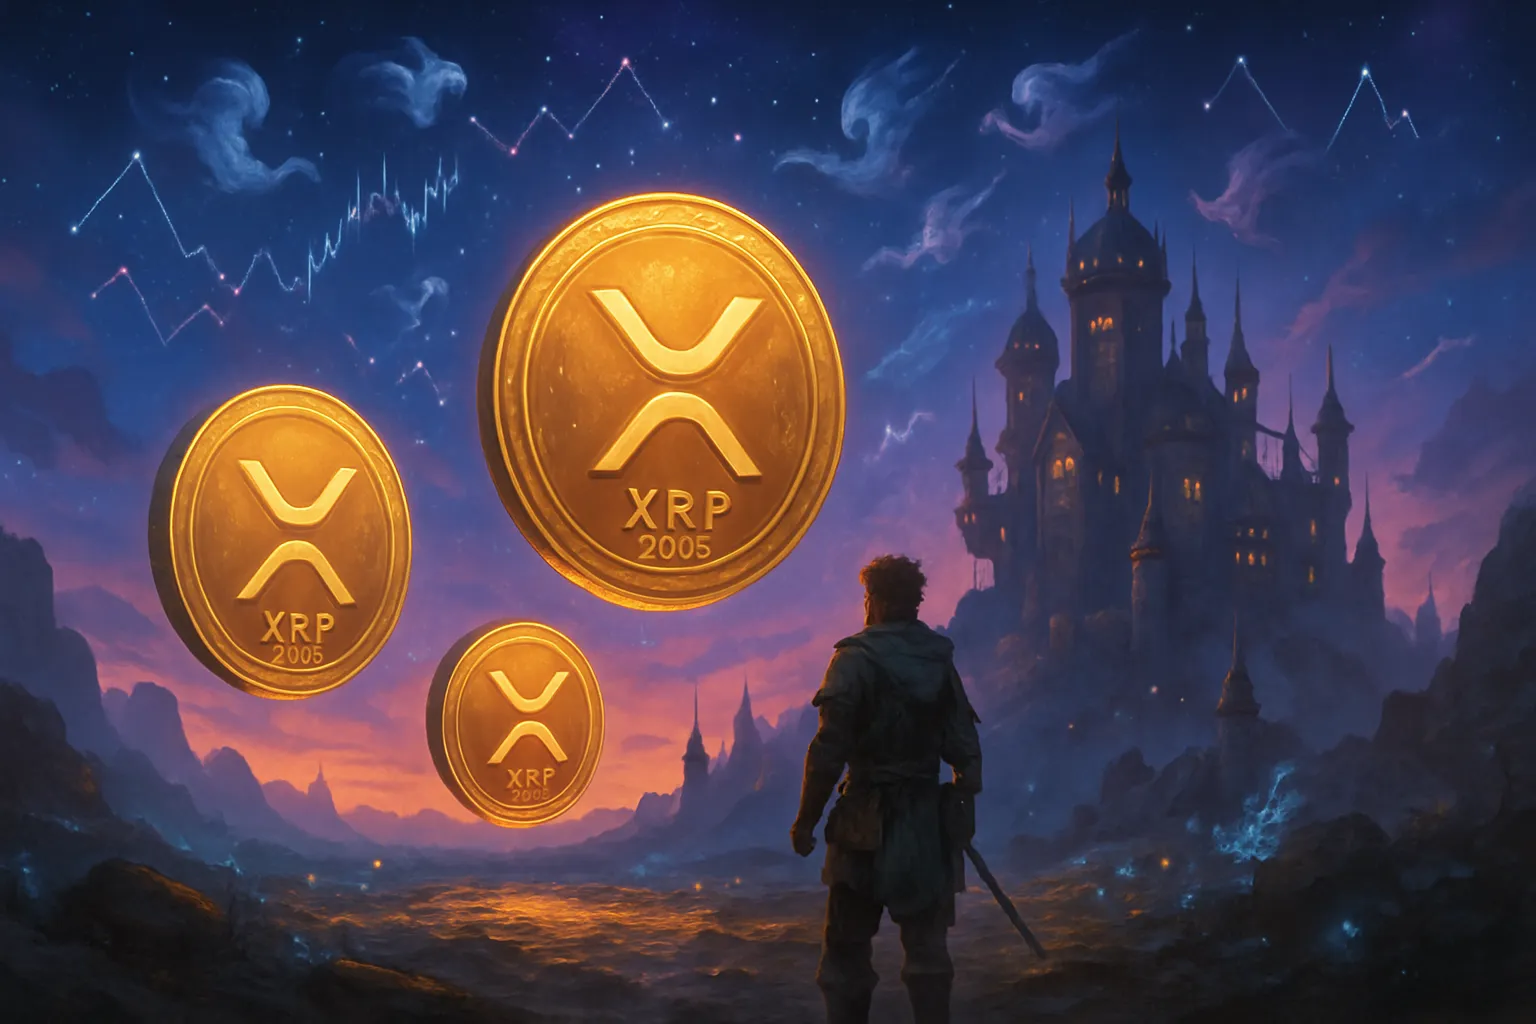
Have you ever stared at a crypto chart, convinced it was actually someone’s lost spaghetti recipe? I have. That’s how I ended up the reluctant owner of 17 XRP coins—more out of confusion than conviction. Fast forward to today, where the internet promises XRP is about to launch into the stratosphere, possibly landing somewhere between seven bucks and a wild $20. But do the signs really point to a mega bullish wave, or is it just déjà vu with a fancier chart? Put on your tinfoil hat and let’s take the scenic route through Ripple country—no financial advice, just good old-fashioned curiosity (and mild panic).
Missed Buses and Broken Resistance: My Crash Course in XRP Price Trends
Let me paint you a picture of my crypto investing prowess: I’m the guy who watched XRP sit at $0.30 and thought, “Meh, I’ll wait for it to drop to $0.25.” Spoiler alert – it didn’t. Instead, it decided to throw the mother of all parties, hitting $3.66 on Friday, which is roughly 12 times what I could have paid if I wasn’t busy being a financial genius.
The sting of missing that bus? It’s like watching your ex get married to someone better looking while you’re still explaining to your mom why you’re single. But hey, at least I can now provide you with a detailed XRP price analysis of how spectacularly I fumbled this opportunity.
The Great XRP Price Rally That I Watched From the Sidelines
Since April, XRP has climbed nearly 90%, which is impressive for any asset, but particularly brutal when you’re the person who said “I’ll buy the dip” and then spent six months waiting for a dip that never came. Instead, XRP decided to smash through resistance levels like they were made of tissue paper.
The XRP price trends have been nothing short of spectacular. We’re talking about a token that went from being the forgotten middle child of crypto to suddenly becoming the prom king. Research shows that technical setups are indicating potential for a parabolic rally if key resistances are broken, which is analyst speak for “this thing might actually moon.”
The 2,200 Days of Doom: Understanding XRP’s Resistance Walls
Now here’s where things get interesting – and by interesting, I mean the kind of fascinating that makes you question every life choice you’ve ever made. The XRP dominance chart shows a resistance level at 5.50% that has held for over 2,200 days. That’s over six years of XRP banging its head against this ceiling like a crypto Sisyphus.
Popular analyst Dom explained it perfectly:
“Every time XRP dominance breaks resistance, we see a 2x rally shortly after.”
This is the kind of technical analysis that makes me simultaneously excited and nauseous, because it suggests that the party I missed might just be getting started.
Studies indicate that XRP’s resistance at this level has held for over 2,200 days, and historically, breakouts have preceded significant gains. It’s like watching a pressure cooker – eventually, something’s got to give.
My Emotional Chart vs. XRP’s Technical Analysis
While analysts are drawing fancy lines on their XRP price prediction 2025 charts, I’m over here drawing my own chart titled “Regret Over Time.” The correlation is uncanny – as XRP’s technical indicators get more bullish, my FOMO reaches new all-time highs.
The XRP/BTC pair is also showing bullish signals, having been rejected over 8 times at key resistance levels. It’s like watching someone repeatedly ask their crush out and finally getting a “maybe” – you know something big is about to happen.
The beauty of missing this bus is that I’ve become an expert in watching other people make money. It’s a skill, really. And according to the charts, XRP might still have room to run, which means I get to continue perfecting this particular talent.
Dominance, Pennants, and Penniless Hope: Decoding the Technical Chatter
Look, I’ll be honest with you. When I first heard about XRP dominance charts and bull pennants, I thought someone was talking about baseball. Turns out, it’s even more confusing than that—but somehow, after spilling my third cup of coffee while trying to decode these patterns, I’m starting to make sense of this technical madness.
Breaking Down Bull Pennants (Without Breaking My Brain)
So here’s what I’ve learned about these mystical creatures called bull pennants. Picture a flag on a pole after your team scores—except instead of celebrating, you’re desperately trying to figure out if your crypto investment is about to moon or crater. Research shows that the combination of volume profile and pennant patterns could mean an explosive rally for XRP if certain levels are surpassed, which sounds promising until you realize you still need to understand what those levels actually mean. The XRP dominance chart recently broke out of a bull pennant in a two-week timeframe, and analysts are projecting XRP.D could hit anywhere between 21% and 275%. That’s quite a range, isn’t it? It’s like saying “the weather tomorrow will be either slightly warm or the surface of Mercury.”
XRP Dominance: The Friend Who Never RSVPs
XRP’s market share behavior reminds me of that one friend we all have. You know the one—they never confirm if they’re coming to your party, but somehow they show up anyway and end up being the life of the event. XRP dominance has been sitting at this 5.75% resistance level for what feels like forever (technically over 2,200 days, but who’s counting?). The Visible Range Volume Profile shows a significant void above 5.75%, which basically means there’s a big empty space where nobody’s trading. Think of it as the crypto equivalent of that awkward silence at parties.
My Quest for the ‘Kaboom Phase’
Egrag Crypto dropped this gem that had me choking on my morning brew:
“Any closure above 5.75% could trigger the Kaboom phase for #XRP Dominance!”
Naturally, I spent the next hour frantically googling “Kaboom phase” and “XRP technical indicators,” only to realize it’s not an official term but rather someone’s colorful way of describing potential explosive price movements. The key Fibonacci levels—0.5 and 0.618 (8.59%)—apparently align with this mythical resistance level.
Fibonacci Levels Made Simple(r)
These Fibonacci levels sound fancy, but they’re basically just mathematical ratios that traders use to predict where prices might bounce. The 0.618 level sits at 8.59% for XRP dominance, and breaking above it could supposedly trigger significant moves. XRP price breakout patterns often rely on these levels, though I’m still not entirely convinced they’re not just sophisticated ways of saying “maybe it goes up, maybe it doesn’t.” Technical indicators play a key role in forecasting potential mega rallies in crypto assets, according to research, but after staring at charts for hours, I’m starting to think my coffee mug might be just as accurate at predicting price movements. Still, there’s something oddly compelling about these patterns—like trying to read tea leaves, but with more math and significantly more potential for financial ruin.

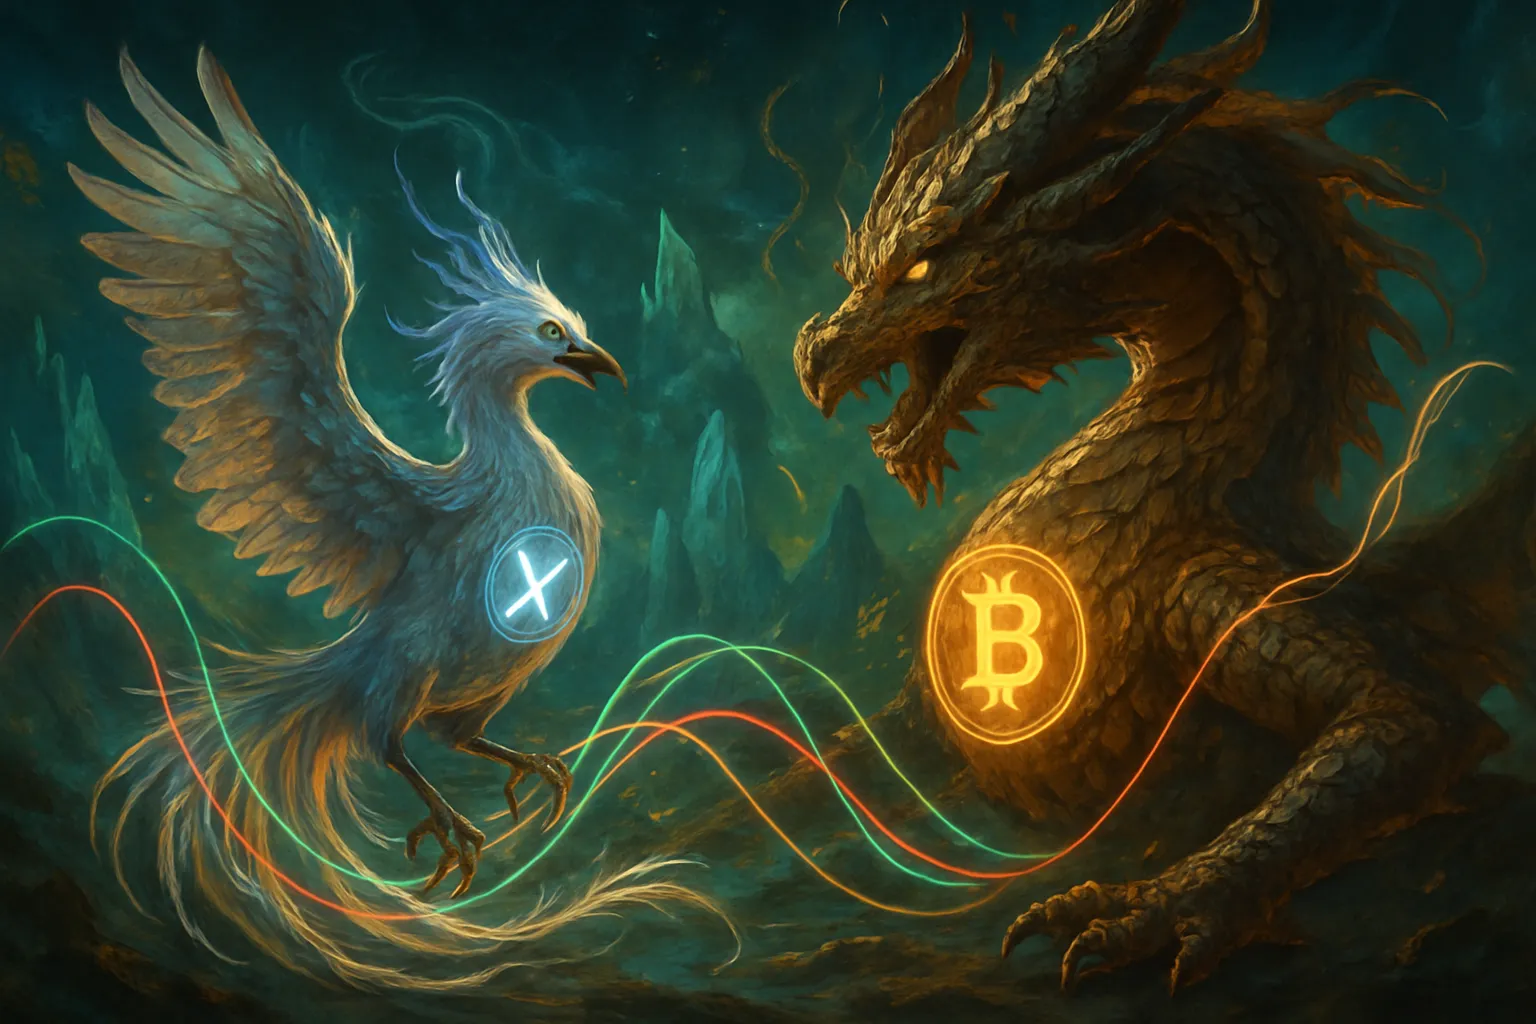
XRP vs. Bitcoin: The Odd Couple and the MACD Plot Twist
Watching the XRP/BTC bullish signals unfold feels like being glued to one of those underdog sports movies—except instead of a plucky football team, we’re rooting for a cryptocurrency that’s been getting its lunch money stolen by resistance levels since 2019. And honestly? The acronyms are way more confusing than any playbook.
Let me paint you a picture of my relationship with XRP technical indicators: I’m basically that guy who shows up to the party right after all the good stuff happens. Remember those legendary XRP MACD bullish cross moments? March 2021 delivered a jaw-dropping 514% rally, followed by November 2024’s respectable 400% gain. Where was I during these financial fireworks? Probably debating whether to buy the dip on some random altcoin that’s now worth less than my morning coffee.
The Stubborn Resistance That Just Won’t Quit
Here’s where things get interesting (and by interesting, I mean frustratingly predictable). XRP resistance levels have been more persistent than a telemarketer during dinner time. This particular zone—a convergence of the value area high from seven years ago and the VWAP from 2018’s all-time high—has been suppressing XRP/BTC since mid-2019. We’re talking over 2,200 days of getting rejected harder than my college applications.
The numbers don’t lie: this resistance zone has shown XRP the door more than eight times. Eight! That’s like asking someone out and getting turned down so many times you start wondering if you should just become a monk.
“Any time this zone is reclaimed, an explosive move occurred shortly after.” – Dom
Dom’s observation hits different when you realize that repeated resistance levels, once conquered, often precede sharp rally phases. It’s like watching someone try to open a stubborn jar—once it finally gives, everything happens at once.
My Personal ‘What If’ Nightmare
Want to know what keeps me up at night? It’s not climate change or whether I remembered to lock my car. It’s the haunting question: would I trade my entire snack cupboard for a time machine to catch those MACD crosses? Because honestly, watching those 514% and 400% gains slip by feels like missing the last slice of pizza at a party.
The MACD bullish crosses have resulted in massive historical gains, suggesting that if this pattern repeats, we might be looking at another explosive move. But here’s the thing about timing the market—it’s like trying to catch a greased pig while blindfolded. Theoretically possible, practically hilarious.
Right now, XRP is knocking on that same resistance door again, armed with technical indicators that look more promising than my dating profile. The question isn’t whether XRP will eventually break through—it’s whether I’ll actually be paying attention when it happens, or if I’ll be too busy analyzing some other chart that goes absolutely nowhere.
Sometimes I wonder if the real treasure isn’t the gains we made along the way, but the sleep we lost staring at candlestick charts at 3 AM.
Targets, Tunnels, and Technical Trouble: Are $7, $10… or $20 Realistic?
So I did what any reasonable person would do when faced with wild XRP price predictions for 2025: I asked my houseplants. My fern looked skeptical, my snake plant just stared, and my peace lily… well, let’s just say it wilted a little when I mentioned $20. Even my vegetation has more sense than some crypto Twitter accounts.
But here’s the thing about those seemingly insane XRP price targets everyone’s throwing around – some of the technical analysis actually looks… uncomfortably convincing? I hate when that happens. It’s like finding out your horoscope was right about meeting a tall, dark stranger who turned out to be your delivery driver.
The Bull Pennant That Won’t Quit
Research shows that technical patterns such as the bull pennant are highly watched for breakout confirmation in crypto trading. And wouldn’t you know it, XRP’s monthly chart is flashing one of these patterns like a neon sign at a questionable roadside diner.
According to the charts (and my increasingly concerned calculator), a monthly close above $2.55 could trigger what analysts are calling a “parabolic move” toward $18 or higher. That’s a 417% increase from current prices. My calculator didn’t just survive this math – it filed a formal complaint with HR.
The technical setup looks genuinely compelling. The XRP bull pennant has been forming on monthly timeframes, and studies indicate that a monthly close above $2.55 may set up a parabolic move to $18+ for XRP. The $3.84 all-time high sits there like that friend who always orders the most expensive thing on the menu – intimidating, but not impossible to surpass.
When Analysts Get Braver Than My Portfolio
Then there’s trader XRPunkie, who makes predictions with the confidence I reserve for knowing what I had for breakfast. This analyst boldly declared:
“Target of $20+- $XRP is a given. It shall happen by the end of this cycle.”
A “given”! Like death, taxes, and my inability to remember where I put my keys. I admire this level of certainty, even if it makes me nervous enough to check my emergency ramen supply.
The XRP price breakout scenario hinges on several technical factors coming together like a perfectly choreographed disaster. XRP dominance charts are showing bullish signals, the XRP/BTC pair is hinting at “explosive” moves (their word, not mine), and MACD indicators are doing that thing where they cross and everyone gets excited.
Reality Check: $20 XRP in Context
Let’s pause and imagine what a $20 XRP would actually mean. At current circulating supply, we’re talking about a market cap that would make some countries jealous. It’s the kind of number that sounds made up until you remember that people once thought $1 Bitcoin was expensive.
The difference between chart theory and breakfast reality is that charts don’t care about your mortgage payment or the fact that you panic-sold at $0.50 last year. They just point upward with mathematical indifference, suggesting that maybe – just maybe – those houseplants don’t know everything about XRP price prediction 2025 scenarios after all.
Bullish Afterthoughts, Wild Card Dreams, and the Case for Responsible FOMO
So here we are, at the end of our wild ride through XRP price predictions and technical analysis rabbit holes. I’ve got to admit something embarrassing: last week, I spent twenty minutes analyzing what I thought was a complex RSI chart, only to realize I was staring at my grocery receipt from Tuesday. The squiggly lines looked promising though—my avocado purchases were clearly forming a bullish pennant pattern.
But seriously, after diving deep into all these charts screaming about “mega bullish waves” and XRP price rallies heading to $20, I’m caught between two equally dangerous emotions: wild optimism and paralyzing skepticism. Research shows that market volatility and emotional reactions can influence price perceptions and trading decisions, and boy, do I feel personally attacked by that statement.
The difference between being “mega bullish” and engaging in “mega wishful thinking” is thinner than my portfolio during a bear market. Sure, the technical setups look promising—dominance charts breaking out, MACD indicators doing their bullish dance, and resistance levels that have supposedly held for 2,200 days finally showing cracks. But let’s be honest: I’ve seen “explosive moves” fizzle out faster than my New Year’s resolutions.
Here’s where my brain goes completely sideways with XRP price volatility: What if, hypothetically, XRP actually hit $1,000? Would I still obsessively check my portfolio before my morning coffee? Would I finally stop calculating how many more coins I could’ve bought if I’d skipped that overpriced latte? Probably not. I’d probably be refreshing charts wondering why it’s not $2,000 yet.
The wild card scenarios are what keep me up at night. Not because I’m losing sleep over potential losses—well, partly that—but because the crypto space has this uncanny ability to make the impossible seem inevitable until it suddenly doesn’t. Ripple XRP price predictions range from conservative $7-$10 targets to moon-bound fantasies that would make even the most optimistic hodler blush.
Studies indicate that responsible trading means balancing optimism with skepticism, which sounds about as easy as explaining blockchain to my grandmother. The reality is that XRP price forecasts for 2025, while backed by technical analysis, still operate in a market where sentiment can flip faster than a pancake on Sunday morning.
The smart money says to invest only what you can afford to lose, especially if you’re prone to sleep-shopping crypto at 3 AM (we’ve all been there). Wild predictions like $500 or $1,000 make for great Twitter arguments but terrible financial planning.
“Every investment and trading move involves risk, and readers should conduct their own research.”
So here’s my take: embrace the excitement, enjoy the ride, but keep your feet planted somewhere near reality. Whether XRP hits $20 or $200, the most important thing is that you can laugh about your journey—preferably while not eating ramen for the third night in a row because you FOMO’d your grocery money into the latest “mega bullish wave.”
Remember folks, the market doesn’t care about our dreams, but our wallets sure do.
TL;DR: If you’re expecting XRP to just chill at $3 forever, think again. Current charts and technical mumbo-jumbo suggest a wild ride to $7, $10, or even $20 in 2025—provided you remember the golden rule: don’t invest more than your pizza budget.